Crazy Correlations
The catalyst for this post was a paper published a few years ago named “Voodoo Correlations in Social Neuroscience”. This controversial paper pointed the finger to a number of neuroscientists that were using fMRI as candy and doing monkey business in the process. The paper generated a lot of buzz and created awareness to the fact, that should be well-known, that correlation alone is not causation. After a heated debate the authors renamed the paper to “Puzzlingly high correlations in fMRI studies of emotion, personality, and social cognition”
In the paper the authors said:
_ We have identified a weather station whose temperature readings predict daily changes in the value of a specific set of stocks with a correlation of r 5 %0.87. For $50, we will provide the list of stocks to any interested reader. That way, you can buy the stocks every morning when the weather station posts a drop in temperature and sell when the temperature goes up._
So I decided to mythbuster-it.
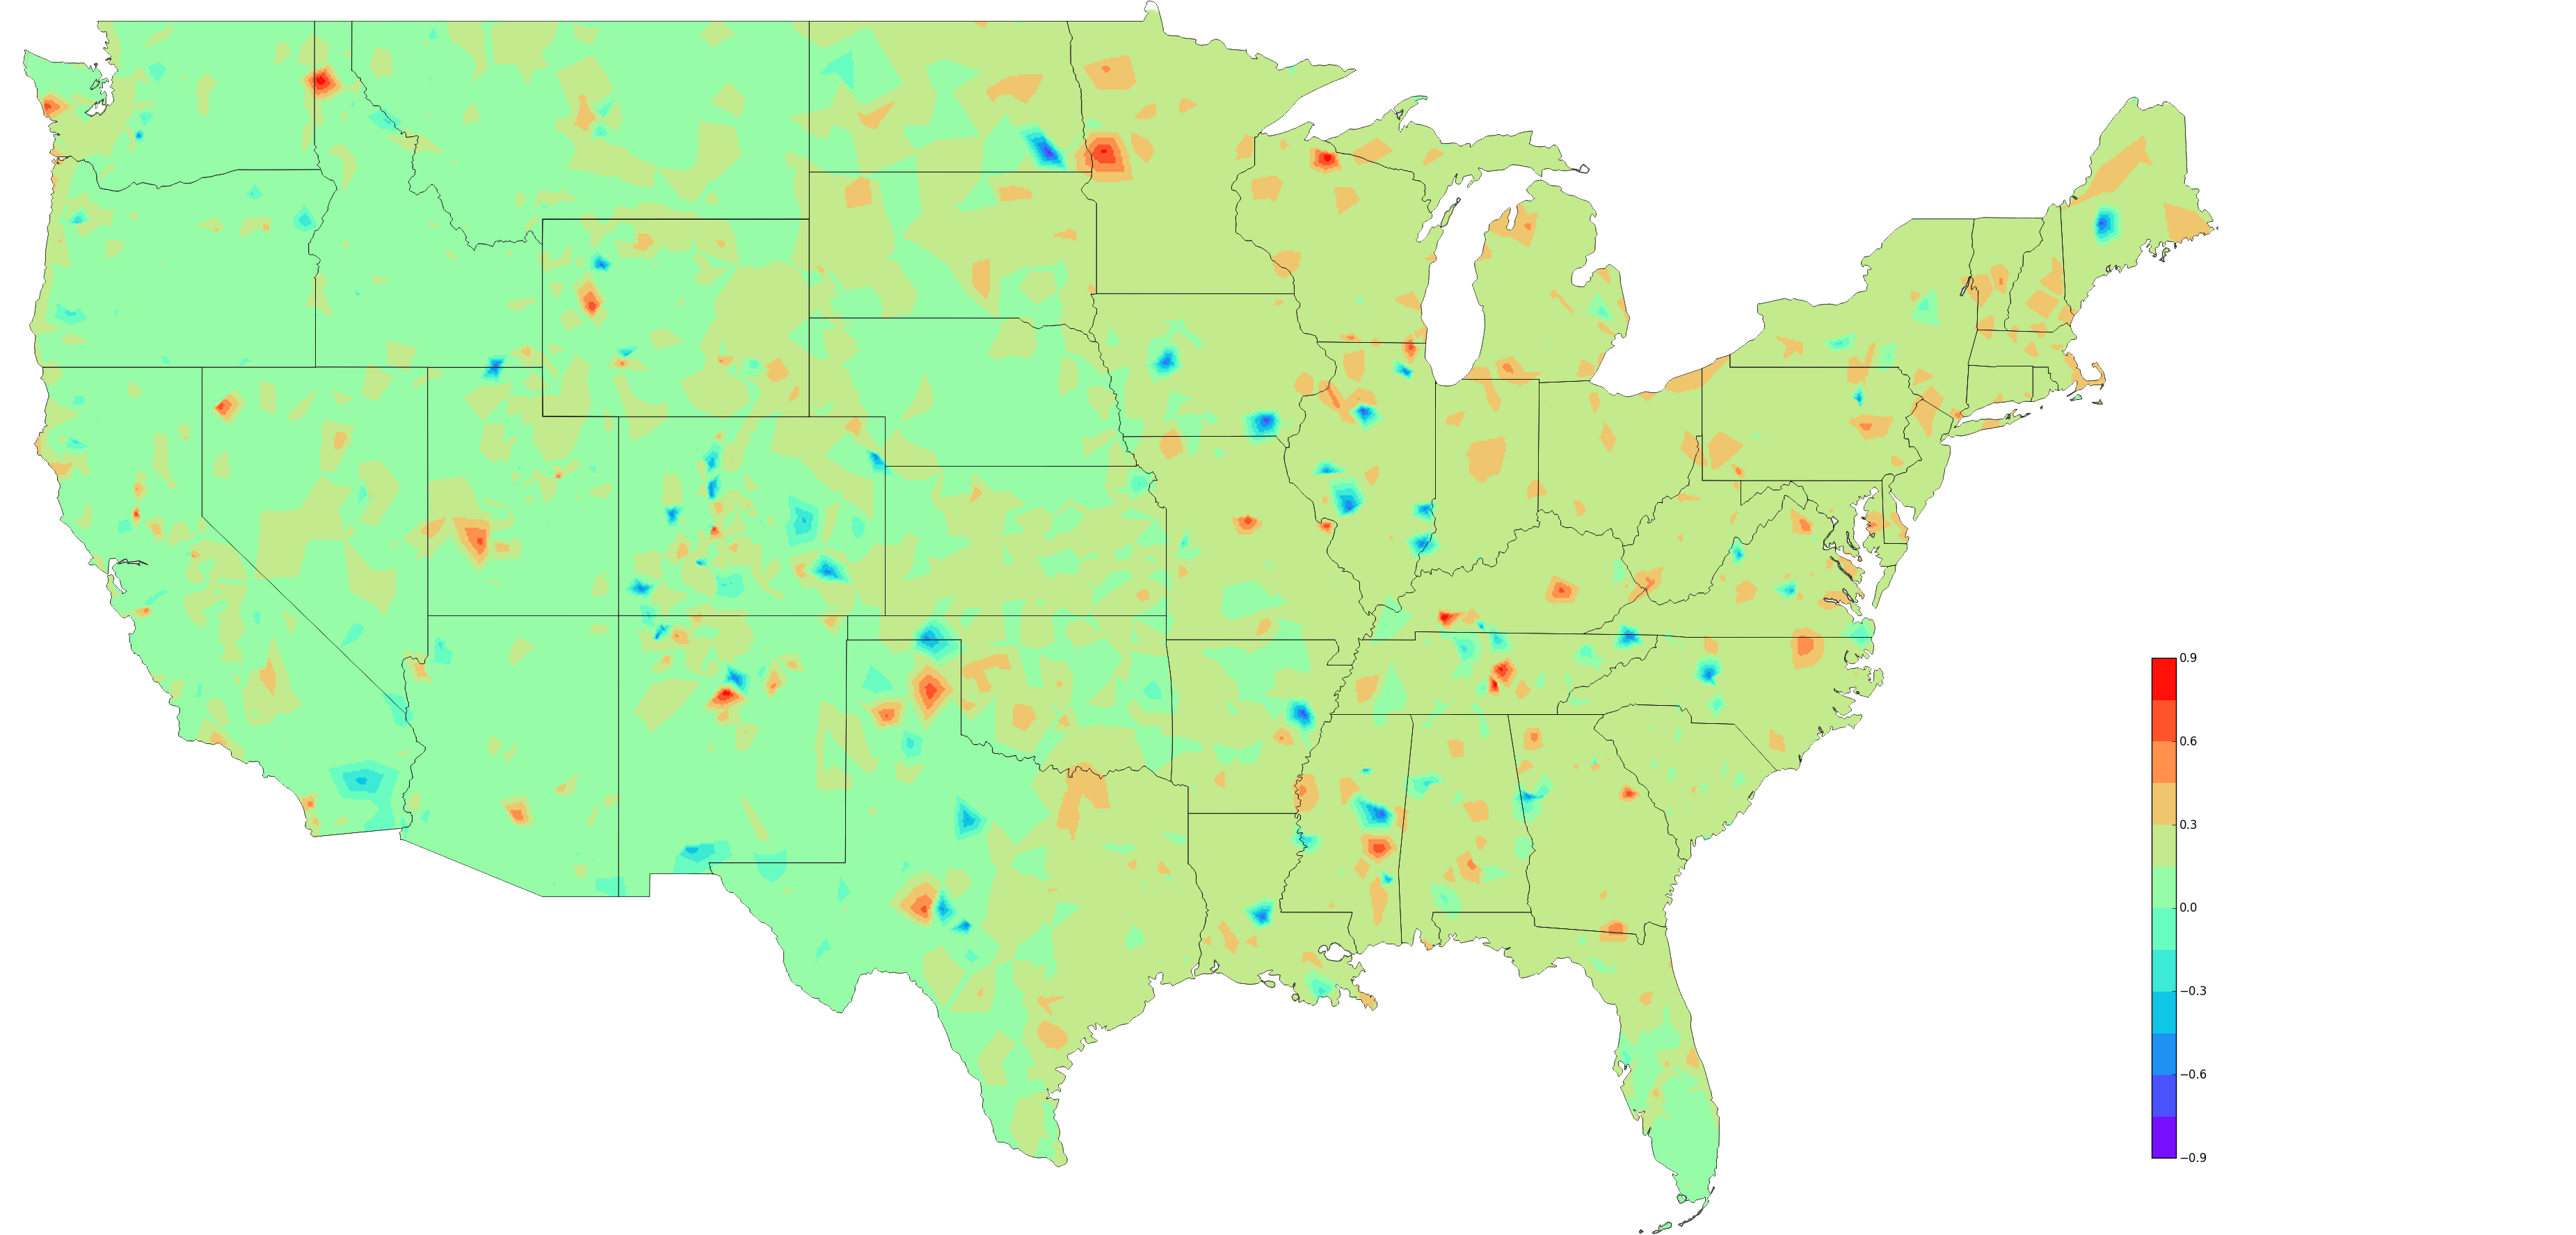
So, look at the map of the correlation between Dow Jones Index and the high-temp of the day
Correlation high-temp vs Dow Jones Index
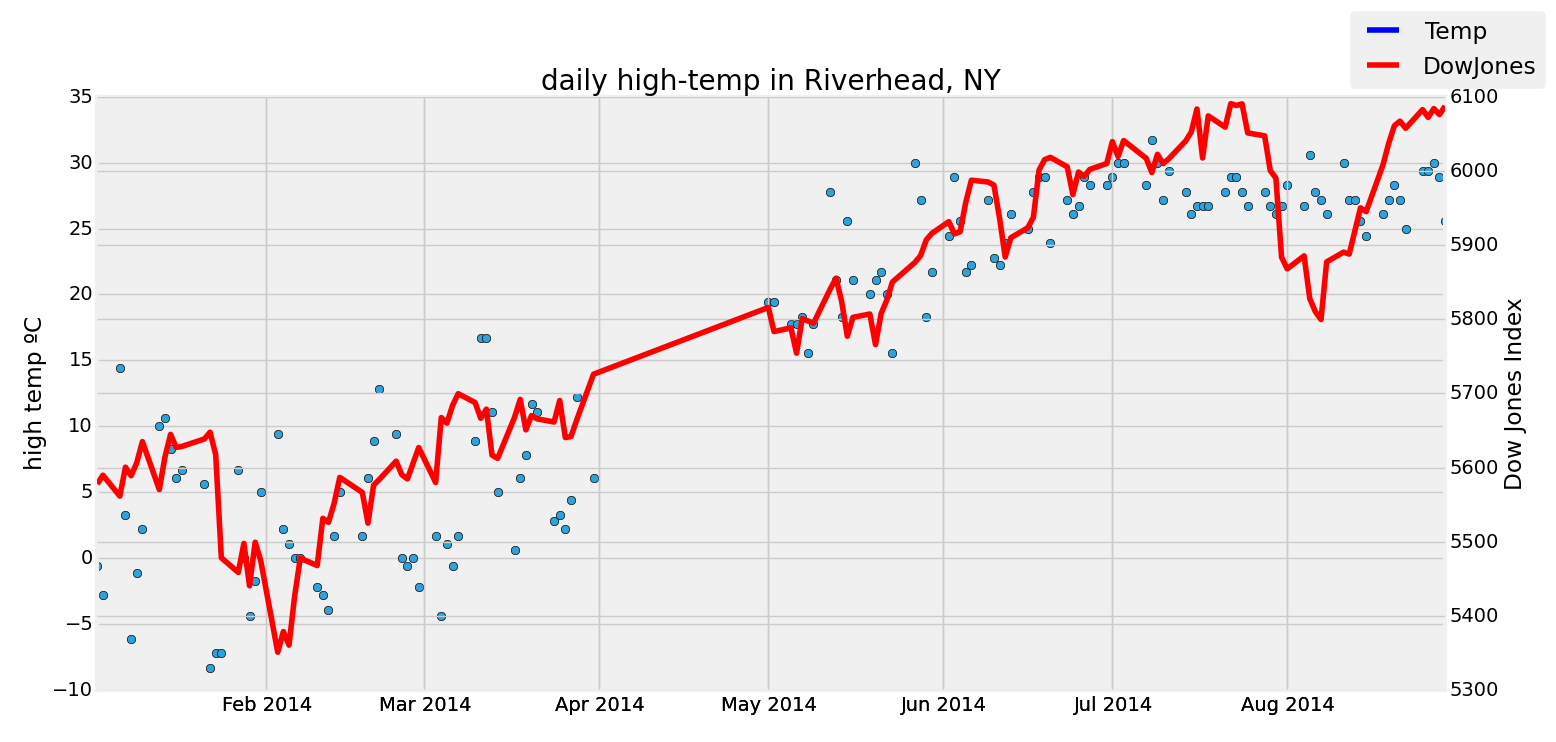
One of the cities with a very high correlation was Riverhead, NY (mostly because of missing temperature data).
Data Sources:
Dow Jones Index (NYSE), Temperatures (NCDC/NOAA)
All data and code for this post is here on Github https://github.com/ppaulojr/CrazyCorrelation/